More and more often, we encounter project data that was created with ESRI products and stored in a Geodatabase file. Autodesk has added the capability to directly access these files through FDO, from within Map 3D and Civil 3D.
To learn more, (and access many tutorials for Map 3D), follow this link...
Thursday, December 9, 2010
Monday, November 15, 2010
Exporting Object Data to a DBF
In our book “Digging Into AutoCAD Map 3D 2011 – Level 1 Training” we cover the basics of Object Data and External Database Links. We explain the differences between these two methods of linking data to AutoCAD objects, and what types of data are appropriate for each.
At some point, you might wish to do a little more with the Object Data than you can from within AutoCAD Map 3D. One very quick and easy way to do this is by EXPORTING the data to a Shapfile, and then opening the accompanying DBF file with a database program like Access, or with a spreadsheet program like Excel. From there, you can use Access or Excel tools to sort and display the object data in various ways, perform counts and math on values, etc.
For the complete tutorial, (and many others) follow this link...
Monday, October 18, 2010
Some Interesting New Views of the Moon
It's amazing what a little color can do to communicate information.
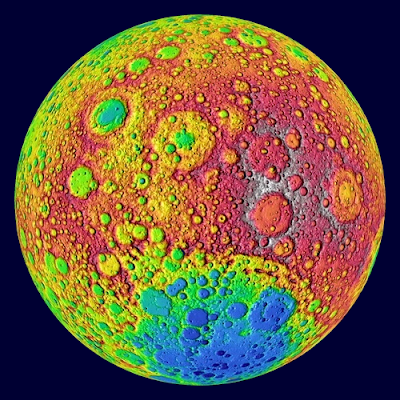
This is a color-coded topographic map of the far side of the moon. Since the Moon has no air or water, and hence no "sea level", zero altitude is set at the Moon's mean (average) radius, of just over a thousand miles. Altitudes below that use bluer tones, suggestive of oceanic regions on the Earth, and altitudes above that green and redder tones, suggestive of land regions on the Earth (areas shown in gray have no reliable altitude data). As the result, the lunar maria, once thought to be oceans, are shown as though they were oceans, while the lunar terrae, once thought to be highlands, are shown as though they were continents.
Follow this link for more maps and descriptions.
Tuesday, September 28, 2010
Plotting Large Image Files
I recently received a 100 MB raster image file from a client, and needed to use it as a background image in a bathymetric map of a reservoir. The image was a very high resolution TIFF file, depicting the bottom of the reservoir in great detail, which the client needed to see in his maps. It looked great in model space, on the layout tab, and even showed up in a plot preview, but when I tried to plot it to a PDF, the image was absent from the final plot.
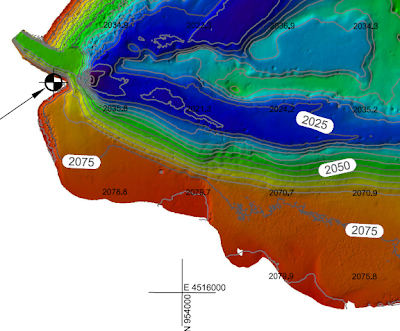
Obviously, when plotting a lot of software and hardware variables come into play. I found a couple of solutions that helped in my situations; perhaps they will help you in similar situations.
For the complete tutorial, (and many others) follow this link...

Obviously, when plotting a lot of software and hardware variables come into play. I found a couple of solutions that helped in my situations; perhaps they will help you in similar situations.
For the complete tutorial, (and many others) follow this link...
Tuesday, September 21, 2010
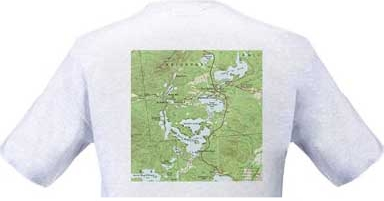
Maps on Clothing
Everyone who knows me knows that I am a map nerd. I surround myself with maps, even on everyday objects. The coffee cup I've used for over 23 years sports a map of the London Underground, and my favorite shirt features coastline patterns from nautical maps.
I thought I would list a few other sources for maps on clothing, starting with my friend Autumn's TopoTees; skillfully printed T-shirts featuring images of some of the lakes in the Adirondacks from vintage USGS quadrangles. If you order one, please tell them: "Russell sent me!"
There are many different sources for maps on clothing. You can also get maps on shoes, jackets, even boxer shorts, but the TopoTees are more my style...
Please send me links to your favorite items featuring maps.
Wednesday, August 18, 2010
A Better Way to Join Polylines
We’ve all been there. It’s crunch time and you encounter hundreds or maybe thousands of individual line segments that should be continuous polylines. The end points are snapped together, but when you try to select them or perform some analysis on them, you get individual lines, or lots of unconnected polylines.
There is a much better, though often overlooked alternative to the Polyline Edit > Join command, in the Drawing Cleanup suite of tools, called Dissolve Pseudo Nodes.
For the complete tutorial, (and many others) follow this link...
There is a much better, though often overlooked alternative to the Polyline Edit > Join command, in the Drawing Cleanup suite of tools, called Dissolve Pseudo Nodes.
For the complete tutorial, (and many others) follow this link...
Wednesday, June 30, 2010
Defining Scale Ranges in the FDO Style Editor
When stylizing Feature Data Objects in Map 3D, there is a powerful setting that many users overlook: Scale Ranges.
One example of how this setting can benefit you is using it to cause a very detailed set of features, such as a street map or a soils map, to only display when that level of detail is useful, and cause it to be invisible when zoomed out to where it would just be a blur of detail.
For the complete tutorial, (and many others) follow this link...
Subscribe to:
Posts (Atom)
